Customer churn isn’t just a marketing problem - it’s a business survival issue. In competitive industries like e-commerce, losing one customer often means losing several revenue streams, especially when one account can represent multiple users.
This post is a breakdown of my churn prediction capstone project for the postgraduate data science program at UT Austin - also tied to my master’s in data science at Deakin U. The project was closed-source, so I can’t release the full notebook, but I’ll walk you through everything I did including code snippets, results, charts, what I learned, and where this project fits in my larger journey into machine learning and MLOps.
🧩 The Problem: Why Churn Matters So Much
The e-commerce company in question faced intense competitive pressure and a rising churn rate. Each lost account didn’t just represent a single user - it impacted groups of customers. That meant multiplicative revenue loss.
Our goals were:
- Predict churn at the account level
- Identify top drivers of churn
- Segment customers for targeted retention
- Recommend cost-effective, revenue-positive strategies
🧪 Dataset Overview & Initial Processing
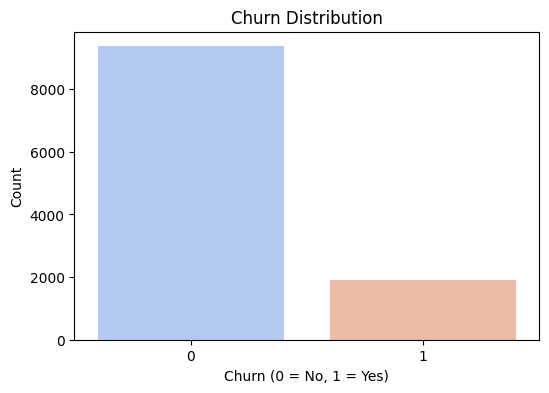
The dataset had ~11,000 rows and 19 columns, combining both categorical and numerical variables. A few key points:
- Heavy class imbalance: Only ~17% of the accounts had churned
- Several columns had missing values which were handled via KNN imputation
- Mix of behavioral data (logins, payments, complaints), service scores, and engagement metrics
🔍 Exploratory Data Analysis (EDA)
Key univariate and bivariate findings:
- Device Used: Desktop users churned more (~20%) than mobile (~16%)
- Revenue Patterns: Lower revenue/month was linked to higher churn
- Complaints: Past complaints were strongly correlated with churn
- Tenure: Shorter tenure customers churned more
- Payment Method: Debit and UPI users churned more than Credit Card users
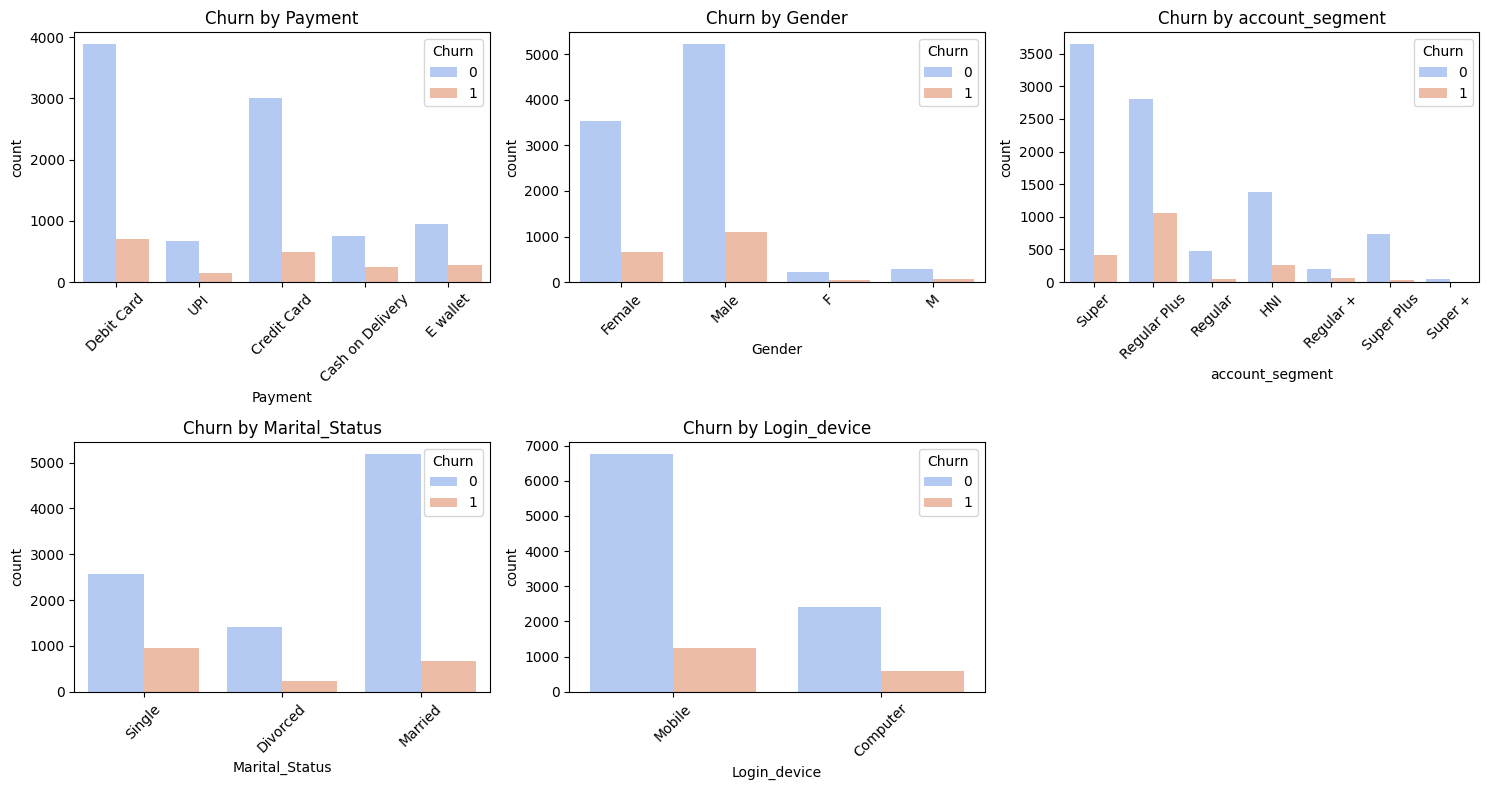
Interestingly, some expected predictors (like cashback or service score) didn’t show strong correlation individually - indicating multi-factorial churn behavior.
📊 Clustering for Segmentation
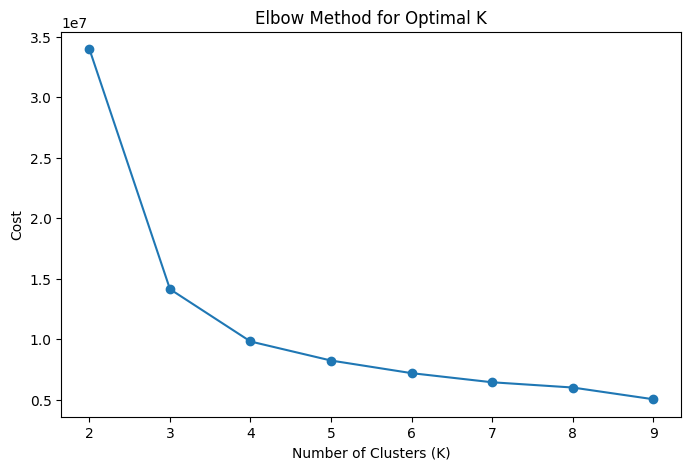
Rather than just modeling churn, we wanted actionable segmentation. Using the elbow method and KMeans, we identified 4 customer clusters.
Each cluster showed different churn profiles, behavior patterns, and required tailored business strategies.
📌 Cluster Highlights & Strategic Takeaways
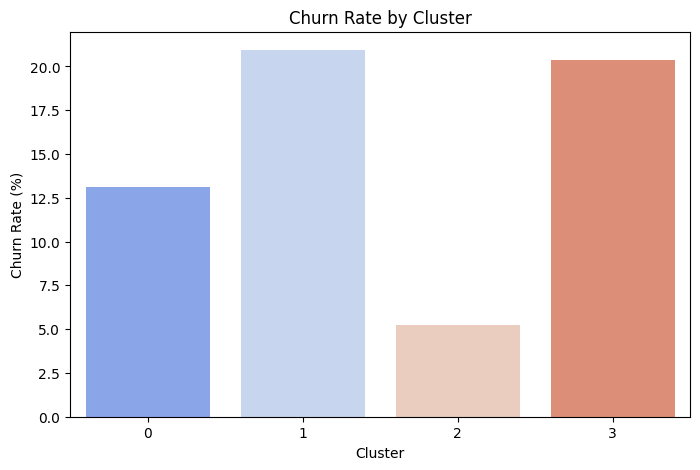
Cluster 1 – Large Segment, High Churn (~20%)
- Male-dominated, married, mobile-first
- Mid-to-high revenue, but frequent complaints
- Strategy: Premium customer care, non-discount loyalty programs, debit-card reward partnerships
Cluster 3 – Smallest, but Worst Churn (~21%)
- Newer users with high cashback dependency
- Low service scores, high complaints, revenue decline
- Strategy: Early engagement triggers, reduce cashback reliance, introduce tiered perks
Cluster 0 – Mid-Tier Churn (~13%)
- HNI and Super users, higher spenders
- Credit card and UPI users, moderate complaints
- Strategy: VIP retention plans, gamified reward systems, re-engagement emails
Cluster 2 – Best Segment (~5% Churn)
- Long-tenure, high-revenue customers
- Highest satisfaction, lowest complaints
- Strategy: Just keep them happy! Introduce premium perks and incentivize digital payments
🤖 ML Model Evaluation & Results
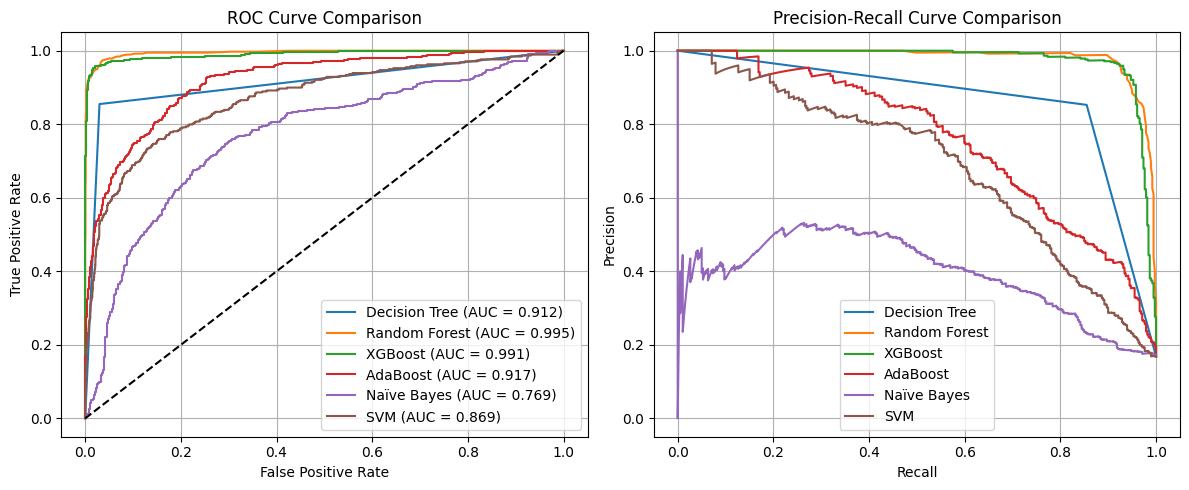
This wasn’t just a segmentation project - I evaluated 6 different machine learning models for churn prediction:
| Model | Test Accuracy | Precision | Recall | F1-Score | AUC-ROC | Overfitting |
|---|---|---|---|---|---|---|
| Decision Tree | 0.9312 | 0.7732 | 0.8364 | 0.8035 | 0.8934 | Yes |
| Random Forest | 0.9742 | 0.9397 | 0.9050 | 0.9220 | 0.9936 | No |
| XGBoost | 0.9694 | 0.9189 | 0.8971 | 0.9079 | 0.9908 | No |
| AdaBoost | 0.8708 | 0.5957 | 0.7230 | 0.6532 | 0.9025 | Yes |
| Naïve Bayes | 0.7127 | 0.3386 | 0.7414 | 0.4648 | 0.7770 | No |
| SVM | 0.7744 | 0.4122 | 0.7995 | 0.5440 | 0.8526 | No |
| Tuned RF | 0.9765 | 0.9822 | 0.8760 | 0.9261 | 0.9960 | No |
Random Forest & XGBoost were the top performers with high precision and AUC scores, and no signs of overfitting, so I ended up tuning the random forest further.
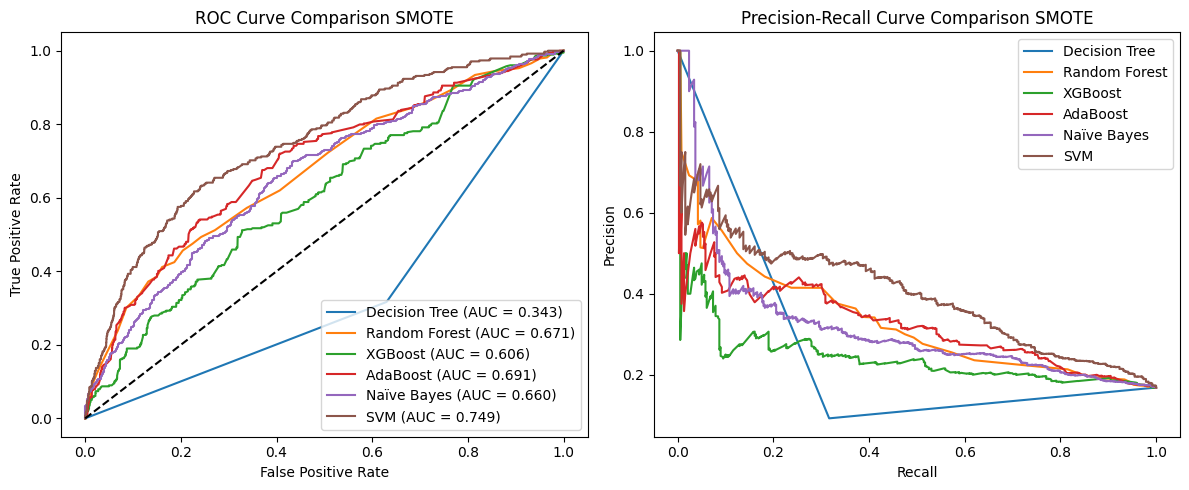
I also experimented with SMOTE for handling class imbalance, but performance dropped significantly across models so oversampling isn’t always the solution.
🔍 Feature Importance (XGBoost)
Top predictors of churn from the model:

- Tenure and Complaints were the most influential features.
- Other strong indicators: customer care interaction history, cashback dependency, and service score.
🎯 Business Outcomes & Learnings
This wasn’t just a modeling exercise - it was a strategy recommendation engine.
Key takeaways:
- Churn is complex: No one variable dominates, but multiple small signals do.
- Clustering works: It lets us build segment-specific retention tactics.
- Complaints matter: Past complaints + low satisfaction are gold for early churn signals.
- Cashback ≠ loyalty: High discount reliance often signals at-risk behavior.
🧭 Business Recommendations by Cluster
Cluster 1 (Large Segment, High Churn ~20%)
- Premium support: Faster complaint resolution and priority escalation.
- Loyalty rewards without discounts: e.g., early access perks.
- Debit-card partner offers & wallet payment nudges.
- Predictive churn alerts + personalized retention bonuses.
Cluster 3 (Smallest, Highest Churn ~21%)
- High-touch onboarding: Loyalty bonuses in first 3–6 months.
- Reduce cashback reliance: Use membership perks instead.
- VIP service model for high revenue churners.
- Improve care response time: Add real-time channels.
Cluster 2 (Lowest Churn ~5%)
- Maintain delight: Premium memberships, early sales access.
- Encourage digital payments with UPI/wallet incentives.
- Reward repeat purchases via tiered cashback.
Cluster 0 (Moderate Churn ~13%)
- HNI support: Personalized account managers.
- Gamified engagement: Spend & Earn reward mechanics.
- Proactive re-engagement emails.
- Introduce premium subscription loyalty tier.
🚀 What’s Next?
This project helped me:
- Think beyond models and into business strategy
- Practice handling imbalanced data
- Understand how to build insights*with both EDA and clustering
It’s part of a broader set of real-world projects I’ll be tackling throughout my second year of the master’s program - with more blogs and eventually open-sourced templates (when possible).
If you’re interested in just nerding out - feel free to connect or drop a note.
Thanks for reading! 🧠📊