It’s been a year in data science and machine learning.
Okay, I lied.
Technically a full year and a few months since I officially splooted (wanted to show off my extensive vocabulary) into the world of data science and machine learning with my master’s program.
In late 2023 I started learning data science through a Udemy course and in January of 2024 I gave up.
Well, not exactly per say.
I realized it will be difficult to manage all that with a life, full time work and family time so, the solution was to do something that holds me accountable and forces me to study, and I enrolled for another masters degree.
Data Science with specialization in Machine Learning.
And looking back, what started as “I need to have some structure, so I’ll enroll into a DS Master’s program” has turned into a deeply satisfying but a sweaty, sometimes highly frustrating journey. It hasn’t just been about attending lectures or submitting assignments.
The real learning, the kind that actually matters, happened when I was diving into actual data, working on pipelines that seemed determined to break, and training countless models that initially flopped.
This isn’t intended as a technical tutorial or a showcase. Instead, think of it as a reflection - a download of the most significant lessons that have shaped my understanding of data science and machine learning principles over the Look, my reason for writing this article are not completely altruistic.
I want to cement these lessons in my mind as well and writing about these is exactly how I plan to do that.
These are insights not just about data and algorithms, but about working with ambiguity, balancing the want for speed with the need for depth, and trying to understand what truly makes someone effective as an ML engineer.
If you’re starting out, perhaps in a similar program, a bootcamp, or even teaching yourself, I hope sharing these reflections resonates and maybe helps you navigate your own path with a bit more clarity (or at least, a little less of that early-days panic).
The lessons below aren’t neatly categorized or presented in some grand order of importance.
They’re simply the insights that have consistently showed up, whether I was building churn prediction models, exploring clustering techniques, or trying to get a deployment pipeline to behave.
Some are technical, some are more about mindset, but all of them are born from real experience.
One last thing before we go ahead with the tips: I have been doing additonal work apart from what is in my curriculum and I think that is very important.
Juggling learning Golang, Rust and doing DL before college actually covers it to trying to read and implement machine learning research papers, just a few things I have been working with.
Focused effort might have gotten me where I am much faster but I think playing around has kept things much more interesting and fresh for someone like me. (classic ADHD behaviour)
Alright, this intro was longer than most blog articles on the internet. Oops.
Let’s get into it.
1. Data Cleaning: It Really Is 80% of the Work (And Your Most Important Teacher)
If there’s one truth that I realized early on, and am very happy about that fact then it’s this: data cleaning isn’t just a preliminary step; it’s a massive chunk of the actual work.
You might have heard the “80/20” rule thrown around, but I don’t think you’ll truly understand the weight of it until you face your first few real-world datasets.

Forget the crystal clear, ready-to-model CSVs you often get in introductory courses. Real data rarely arrives gift-wrapped.
I remember working on a project with customer transaction data. Excited to get to modeling, I opened the files and well, it was a significant challenge.
Missing values weren’t just occasional; they were substantial gaps. Formatting was all over the place - dates in multiple styles, numbers being picked up as strings with embedded characters, categorical labels with stupidly minor variations (“Region A,” “region_a,” “A Region”) that all meant the same thing but would confuse the algorithms.
And outliers? Well Well Well.
Initially, it’s easy to think you’re doing something wrong, or that your technical skills are lacking because the data isn’t behaving. At least I felt that way.
It felt like I was constantly hitting blocks before I could even begin what I thought was the “real” data science. But I’ve come to realize that dealing with this initial mess is fundamental.
This isn’t just “janitorial work,” it’s where you truly start to understand “data science”.
Why This Tedious Data Cleaning Process is Invaluable
The process of cleaning and preparing data forces you to engage deeply with it. When you play with missing values, you’re not just deciding whether to impute or remove them; you also end up asking why they’re missing. (at least I hope you do)
Is it a systematic issue with data collection? Is the absence of a value a signal in itself? These questions often lead to valuable insights. For example, in one dataset, a pattern of missing information in a particular field actually correlated with a specific customer segment we hadn’t initially considered.
Similarly, standardizing categories or correcting entries requires you to understand the context behind the data points.
It’s an iterative process of hypothesizing, checking, and refining.
This back-and-forth dialogue with the data is where real understanding is built. It’s less about mindlessly applying functions and more about being a good detective.
Through the effort of working with broken datasets, I didn’t just end up with a cleaner dataset. I gained a much better feel for the structure, limitations, and its potential. You start to see patterns, anomalies, and relationships you would have completely missed otherwise.
I know this might feel like I am romanticizing it too much, in fact I feel the same as I am writing this, but what’s true is true.
Practical Approaches and Key Takeaways for Data Handling
So, how do you approach this effectively?
Here’s what I’ve learned:
Master Your Tools (Especially Pandas): For anyone working in Python, a strong hands-on on Pandas is a non-negotiable. Functions for inspecting data (
.info(),.describe(),.value_counts(),.isnull().sum()), for cleaning (.fillna(),.dropna(),.astype(),.replace()), and for transformation (.apply(),.map(), merging/joining dataframes) are going to be your bread and butter.A very underappreciated resource these days is the official documentation of any library, especially by beginners. Don’t skip on Pandas documentation - it’s an invaluable resource.
Visualize for Diagnosis: Often, a quick plot can show issues more effectively than staring at rows of numbers. A histogram can highlight outliers or skew in numerical data.
A bar chart of categorical counts can quickly show inconsistent labeling or imbalanced classes. Libraries like Matplotlib and Seaborn are vital for this kind of exploratory and diagnostic visualization.
Iterate and Document: Data cleaning is rarely a linear process. You’ll clean some, explore further, pull your hair on new issues, and refine your cleaning steps.
One huge mistake that I did was I did not document things enough from day 1, so document every transformation you make and why you made it.
Use comments in your code or take detailed notes in a Jupyter notebook, this is important for reproducibility and for your own understanding when you come back to the project later.
I learned this the hard way after trying to backtrack my steps for a project I’d set aside for a few weeks.
Assume the person who will maintain your code next is a pissed off version of yourself from three months in the future and document your code for that person.
Make the future you’s life easy.
Domain Knowledge is Key: If possible, talk to people who are either know how the data was generated or what it really means. Understanding the business process or the context can help clear ambiguities and make your cleaning decisions for you far better than guessing what is important and what is not.
“Garbage In, Garbage Out” Principle: This is absolutely central to data science. No matter how next level your model is, if it’s trained on garbage data, its predictions will be, well you guessed it: garbage.
The effort you put in cleaning and preprocessing is a direct investment in the quality of your results.
Learning to “really” clean and prepare data is about developing a critical mindset and a deeper appreciation for the raw material.
And I am not overexaggerating when I say, “It’s foundational to everything that follows.”
2. Feature Engineering Matters More Than Fancy Models (Often, Anyway)
When I first started, like everyone else I was only interested in complex algorithms. Why? Because they make you feel smart. And what good is data science if you feel stupid?
Right at the start I spent a good amount of time thinking about which model to choose, how to tune all those hyperparameters, and whether I needed ensembles or what not.
But a funny thing happened as I was aiming for State-of-the-Art performance: I realized that simpler models often performed surprisingly well, sometimes even better, when I focused more on creating really solid features. (infact my capstone Churn Analysis project for year 1 is a great example of this)
I had evaluated 6 different machine learning models for churn prediction:
| Model | Test Accuracy | Precision | Recall | F1-Score | AUC-ROC | Overfitting |
|---|---|---|---|---|---|---|
| Decision Tree | 0.9312 | 0.7732 | 0.8364 | 0.8035 | 0.8934 | Yes |
| Random Forest | 0.9742 | 0.9397 | 0.9050 | 0.9220 | 0.9936 | No |
| XGBoost | 0.9694 | 0.9189 | 0.8971 | 0.9079 | 0.9908 | No |
| AdaBoost | 0.8708 | 0.5957 | 0.7230 | 0.6532 | 0.9025 | Yes |
| Naïve Bayes | 0.7127 | 0.3386 | 0.7414 | 0.4648 | 0.7770 | No |
| SVM | 0.7744 | 0.4122 | 0.7995 | 0.5440 | 0.8526 | No |
| Tuned RF | 0.9765 | 0.9822 | 0.8760 | 0.9261 | 0.9960 | No |
Random Forest & XGBoost were the top performers with high precision and AUC scores, and no signs of overfitting, so I ended up tuning the random forest further.
I also experimented with SMOTE for handling class imbalance, but performance dropped significantly across models so oversampling isn’t always the solution.
Is XGBoost the most complex model you can ever work on? No. There are 50 more things I could have done here with the models.
Same goes for random forest, even though they aren’t technically simple as other basic ML models but they are relatively simple to what could have been done here.
So, what’s feature engineering?
It’s basically using your understanding of the data and the problem you’re tackling, along with some creativity, to transform raw data into signals your model can effectively learn from.
Remember I told you about domain knowledge earlier.
Knowing which ratios to create in a digital marketing dataset will really be effective if you spend a little bit of time to understand the domain and the problem you are trying to solve.
The goal is to make the underlying patterns in the data much clearer.
Think of it like this: you could have a powerful telescope, but if the sky is full of clouds - meaning your raw data is noisy or doesn’t offer much useful information - you won’t see very much.
Good feature engineering clears away those clouds, or even better, it highlights the specific constellations you need your model to focus on.
I was working on a project trying to predict equipment failure. Initially, I threw a bunch of raw sensor readings into a complex model and got mediocre results. Then, I started thinking about what might actually indicate an impending failure. Instead of just temperature_reading_time_X, what if I created features like rate_of_temperature_change_last_hour, or time_since_last_maintenance, or deviation_from_average_reading_for_this_sensor_type?

Even a simpler logistic regression model started showing much better results. These new features directly tied to hypotheses about the problem.
The Art and Science of Feature Creation
Good feature engineering is a blend of art and science.
Domain Knowledge is Key: Yes I am repeating myself, but if there was 1 thing you should take away from behemoth of this article then it should be this. Understanding the problem space is crucial. If you’re predicting customer churn, understanding customer behavior, common pain points, or product usage lifecycles will give you ideas for features (e.g.,
days_since_last_login,number_of_support_tickets_opened,change_in_usage_frequency).Transformations are Your Friend: This can be as simple as taking the log of a skewed variable, creating interaction terms (multiplying two features if you think their combined effect is important), or binning continuous variables into categories (e.g., age groups). For date/time data, features like
day_of_week,month,is_holiday, ortime_elapsed_since_Xcan be also be powerful. (is_holidayis a sneaky one btw, especially for ecommerce problems)It’s Iterative: You won’t come up with all your best features on day one. It’s a process of brainstorming, creating, testing, and refining. You’ll build a model, see where it struggles (error analysis is also your friend here), and then go back to think if there are new features that could help it understand those tricky cases.
Don’t Underestimate Simplicity: Sometimes the most impactful features are surprisingly straightforward. It’s not always about complex polynomial expansions or deep learning-based embeddings.
I now see feature engineering as a form of storytelling. You’re guiding your model, pointing out the most important clues in the data, and helping it build a more robust understanding of the relationships you’re trying to predict.
When you get this right, you often find that a well understood, interpretable model like logistic regression or a decision tree can outperform a black box that’s struggling with suboptimal features.
Spend time here.
It almost always pays off.
Check out books like “Feature Engineering for Machine Learning” by Alice Zheng & Amanda Casari, or even just browse Kaggle to see how top competitors approach feature creation for similar problems.
The book I shared is an old one but the principles behind feature engineering don’t really change even if the actual tech, libraries, frameworks might change year on year.
3. Imbalanced Data: Uncomfortable & Frustrating But Its The Reality We Must Face
Most of the really interesting, real-world problems I worked on involved imbalanced datasets (minus the first ML problem - that was magical even though I was simply training a linear regression model).
For example fraud detection (most transactions are not fraudulent), rare disease prediction (most people are healthy), or even certain types of customer churn (if you have very low churn, thankfully!). In these scenarios, the “thing” you’re trying to predict - the minority class - is heavily outnumbered by the “normal” or majority class.
This was a huge learning curve. Why? Because everything you think you know about model evaluation, especially accuracy, gets thrown out the window.
Think about it: you have a dataset where only 1% of cases are fraudulent.
A model that simply predicts “not fraudulent” for every single case would still be 99% accurate!
Sounds great, right? But it’s completely useless because it hasn’t identified a single true case of fraud.
This is where I had my “aha!” (or “oh damn!”) moment.
Working with imbalanced data forces you to think much more deeply about what “good performance” actually means in the context of your problem.
- Metrics Beyond Accuracy: Learn that precision, recall, and the F1-score exist as well as soon as possible.
- Precision: Of all the times your model predicted as positive (e.g., fraudulent), how many actually were positive?
- Recall (Sensitivity): Of all the actual positive instances, how many did your model correctly identify? (You want to catch as much of the “bad stuff” as possible).
- The F1-score is the harmonic mean of precision and recall, basically a single metric to balance them.
- ROC curves and AUC (Area Under the Curve), and especially Precision-Recall curves (PR-AUC), are important for understanding the trade-offs at different decision thresholds. PR-AUC is often more helpful than ROC-AUC for highly imbalanced datasets.
- Understanding Business Costs: Imbalanced problems force you to think about the cost of different errors. Is a false positive (flagging a good transaction as fraud) more or less costly than a false negative (missing an actual fraudulent transaction)? The answer will of course influence how you’ll tune your model and choose your thresholds.
- Specialized Techniques: You start exploring techniques specifically designed for imbalanced data. This might include:
- Resampling: Oversampling the minority class (like with SMOTE - Synthetic Minority Over-sampling Technique, which creates new synthetic examples of the minority class) or undersampling the majority class. Each has its pros and cons. I found that just randomly oversampling often led to overfitting, so techniques like SMOTE, which are a bit smarter, were more helpful.
- Cost-Sensitive Learning: Some algorithms allow you to assign different weights to misclassification errors, effectively telling the model that misclassifying a minority class instance is “worse.”
- Ensemble Methods: Sometimes, ensemble can be adapted to work well with imbalanced data.
More than anything, working with imbalanced datasets taught me to be a more critical thinker.
It pushed me away from chasing a single accuracy number and forced me to engage with the core of the problem, the limitations of the data, and the practical implications of my model’s predictions.
If you’re facing this, I’d recommend looking up research papers on “imbalanced learning” or specific techniques like SMOTE to get a deeper understanding. On second though, a proper research paper might be overkill for this, there are many great blog posts and articles explaining these concepts with practical code examples too, so check those out. (Official documentation is a great way to go)
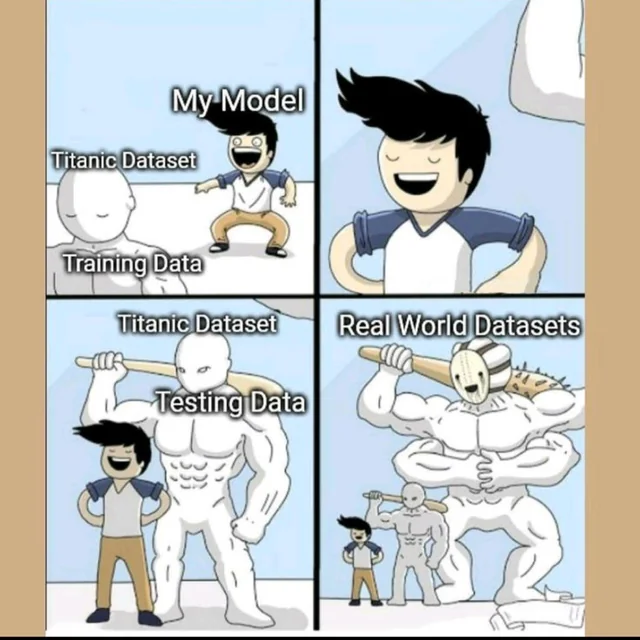
4. Always Work With Real-World Data (Or As Soon As You Can)
Clean, synthetic datasets like Iris or the Titanic dataset are great when you’re first learning the about a new algorithm or library. They allow you to focus on the mechanics without getting pulled down.
But, and this is a big but, the faster you can transition to working with messy, real-world datasets, the faster you’ll grasp what data science is actually like in the real world.
What I have come to understand is that data science isn’t primarily about solving perfectly defined puzzles with clean inputs. It’s about making sense of ambiguity, working through complexity, and dealing with often incomplete information.
Real-world datasets are going to throw all of this at you and you will love it. (at least after pulling some of hair you will)
Context is Everything: Real data comes with real context. You’re not just predicting a number; you’re trying to solve a problem for a business, a scientific puzzle, or a need.
This forces you to ask better questions: Who generated this data? Why? What are the known limitations? What does a “good” outcome actually mean for the stakeholders? This mind shift from a purely technical to a problem-solving one is really important.
Embrace the Mess (Again): As I mentioned above in data cleaning section, real data will test your patience and your skills.
This is where the most valuable learning happens. It’s one thing to read about handling missing data; it’s another to stare at a column with 30% missing values for a critical predictor and have to decide on a strategy. (or should you give up and retire into a forest completely offgrid)
Humility: Real world data doesn’t care about your perfectly crafted
sklearnpipeline or how well your model performed on a Kaggle competition with pre cleaned data.It will expose the flaws in your assumptions and challenge your creativity. This is a good thing! It keeps you grounded and focused on robust, practical solutions.
The first time I was given a dataset from an ongoing business process. It was a collection of spreadsheets, shopify exports, google ad campaign exports and even some manually entered logs for various SKUs for a company with 3 ecom stores.
The documentation was 0. The task was somewhat vaguely defined: can you help us with your ‘data science’ to get better ROAS, which is return on advertising spend just in case you are not from marketing side of the world.
My initial reaction was simply me getting a bit flustered. But as I started to dig in, asking questions, and trying to piece things together, I learned more in those few weeks than in months of structured tutorials.
I learned about data governance (maybe, I guess I did), the importance of clear communication with data owners, and the iterative nature of problem definition.
So, my advice is: try out real-world projects.
This could be through internships, capstone projects, contributing to open source projects that use real data, or even finding public datasets from government agencies, non-profits, or platforms like Kaggle (but look for the less polished “real” datasets, not just the clean competition ones).
The experience will be invaluable.
5. Model Evaluation is So Much More Than Accuracy
For a surprisingly long time, I equated “good model” with “high accuracy.” And I think most students in my class did too.
It’s an easy metric to understand and often the default in many courses.
Then came the churn project where a model with really good accuracy was, in reality, failing to identify most of the customers who were actually churning.
That was a cruel but necessary wake up call: accuracy can be incredibly misleading, especially with imbalanced classes or when the costs of different errors vary significantly.
Metrics like precision, recall, and the F1-score are not just academic concepts; they are important for understanding a model’s performance in a way that aligns with actual business or real world objectives.
The Confusion Matrix is Cool: Don’t just look at the aggregate metrics.
Dig into the confusion matrix.
How many true positives, true negatives, false positives, and false negatives are you getting?
Seeing these raw numbers usually tells a much clearer story.
For that churn model, the confusion matrix clearly showed that we were correctly identifying most non-churners (true negatives), but we were missing a huge chunk of actual churners (false negatives).
Align with Goals: A model that identifies fewer churners but is very precise about the ones it does identify might be more useful if the intervention to prevent churn is expensive.
If the intervention is cheap and catching as many potential churners as possible is the most important thing, recall becomes more critical.
These trade-offs are always present.
Simulate Business Impact: Whenever possible, try to translate model performance into potential business impact.
If your fraud model catches an extra X% of fraud, what does that mean in terms of dollars saved?
If your recommendation engine improves click-through by Y%, what’s the potential revenue impact?
This will help bridge the gap between technical metrics and stakeholder understanding.
Now, when I evaluate a model, I go through a checklist like this:
- What is the actual goal? What problem are we trying to solve?
- What are the costs of different types of errors (false positives vs. false negatives)?
- Is the dataset imbalanced? If so, accuracy is probably not the primary metric.
- What do the confusion matrix, precision, recall, F1-score, ROC-AUC, and PR-AUC tell me?
- Can I look at predictions for specific segments or edge cases to understand where the model excels and where it fails?
- Who will use this model, and what decisions will it drive? Does my evaluation provide them with the information they need to trust and use it effectively?
Thinking beyond a single number and about the broader context as well as consequences of a model’s predictions is what separates a data analyst from a data scientist who can deliver real strategic value.
6. EDA Isn’t Just a Checkbox
In many tutorials and college class settings, Exploratory Data Analysis can sometimes feel like a “let’s just get done with it fast so we can move to the cool stuff” step: generate a few bar charts, a heatmap, calculate some summary statistics, and then quickly move on to modeling.
And look, I am guilty of doing this too. “Let’s get through the charts so I can build the actual model.” I now realize how shortsighted that was. In the real world, EDA is often where your actual understanding of the problem and the data really begins. It’s where the data starts to speak to you, if you listen carefully. Okay maybe “data speaks to you” is a bit too much, but you get the point, right?
Deep EDA has saved me from going down wrong paths and has often helped me find insights that were far more valuable than the eventual model itself. Yep, that happens. Ask any data scientist working with real world data.
Finding Hidden Stuff: EDA is your chance to find the “unknown unknowns.” It helped me find outliers that weren’t just errors, but represented genuinely unusual (and important) events. It meant surprising correlations between variables I hadn’t initially thought were related. I’ve found seasonality trends, data entry biases, and missing value patterns that told a story about the underlying processes generating the data.
Boost to Feature Engineering: The insights from EDA are direct inputs into your feature engineering process. If you see a non-linear relationship between a variable and your target, well, a transformation might be needed. If certain categories in a feature behave very differently, that might mean you need a new grouping strategy.
Refining the Problem: Sometimes, what you discover during EDA can lead you to reframe the entire problem. You might realize the target variable isn’t what you thought it was, or that the available data is better to answer a slightly different, but maybe equally valuable, question.
Helping Build Intuition: Simply spending time visualizing and summarizing your data in different ways builds an intuition for it. You start to “feel” it, its quirks, its strengths, and its weaknesses. This intuition is invaluable when it comes to modeling and interpreting results.
My EDA process now is much more patient and curious.
I use a combination of tools, even though they are basic and fundamental:
- Pandas or similar libraries can give a great automated overview to start with, highlighting potential issues quickly.
- Matplotlib and Seaborn (and sometimes Plotly for interactive visuals) are my go-to for custom plots. Histograms, box plots, scatter plots, pair plots, heatmaps of correlations - each tells a different part of the story.
- I ask a lot of questions: “What does the distribution of this variable look like?” “How does this variable relate to the target?” “Are there any strange patterns or clusters?” “What happens if I segment the data by X or Y?”

If you’re rushing through EDA, you’re likely leaving insights on the table.
The better your EDA, the better your hypotheses, your features, your models, and ultimately, your ability to solve the problem. Period.
It’s an investment that pays dividends throughout the entire project lifecycle.
7. Version Control Isn’t Just for Software Engineers, It’s For Data Scientists Too
I cannot emphasize this enough: learn Git. Use Git. Make Git your friend.
Even if you’re working solo on a small project.
Even if you’re just experimenting with a new dataset in a Jupyter Notebook.
Version control isn’t just a tool for large software development teams pushing production code; it’s a great practice for tracking your thought process, managing your experiments, and saving yourself from countless headaches.
There were times, especially early on, when I’d be tweaking a script or a notebook, trying different approaches, and suddenly realize I’d broken something that was working the day before.
And I’d have no clear idea what I changed or how to get back.
That feeling is awful.
Git is the safety net that saves you from this.
Your Personal Time Machine: With Git, you can commit your changes at meaningful checkpoints. Think of commits as snapshots of your project. If you mess something up, you can always revert to a previous working version.
Understanding Your Own Work: Writing good commit messages (e.g., “Implemented feature X,” “Fixed bug in data cleaning for Y,” “Experimented with Z hyperparameter for model A”) forces you to articulate what you’ve done. When you look back at your commit history, it becomes a log of your project’s evolution and your decision making process. It’s surprisingly helpful for remembering your own train of thought.
Branching for Experiments: Want to try a totally different approach to feature engineering without messing up your main working version? Create a new branch! You can experiment freely in that branch, and if it works out, merge it back. If it doesn’t, you can just discard the branch. This is fantastic for trying out new ideas.
Collaboration (Even with Future You): If you ever work with others, Git is non-negotiable for managing contributions. But even for solo projects, “future you” will thank “past you” for a well maintained Git repo when you need to come back to an old project.
It Feels Professional: Honestly, getting comfortable with Git and GitHub also just makes you feel more competent and smart. And who doesn’t love a bit of an ego boost.
Learning Git has a bit of a curve, I won’t lie. Concepts like staging, committing, branching, merging, and remotes can be confusing at first. Start simple: git init, git add ., git commit -m "My awesome work", git push.
Gradually add more commands as you need them. As I started to contributing to open source and other repos I started to learn more and more about Git and diffrent workflows and commands.
I’m not sure I still know it well but more often than not I’m able to troubleshoot if I get stuck somewhere with Git now, and then there are always AI tools around to help explain the errors.
8. One Deep Project Beats Ten Shallow Ones
In the rush to build a portfolio or feel productive, it’s easy to fall into the trap of trying to complete many small, quick projects. The “10 projects in 10 weeks” mentality. While there’s some value in getting exposure to different datasets and problems, I’ve found that you will learn the most from going deep on a single, substantial project.
My capstone project, which involved developing a customer segmentation model for an e-commerce dataset, taught me more than a dozen smaller tutorial-based projects combined. Why? Because depth forces you to deal with the complexities that shallow projects often just skim over.
End-to-End Experience: A deep project usually means taking something from raw data all the way to a final output, whether that’s a deployed model, a detailed report, or a presentation of insights. This means you have to work with every stage: data acquisition, cleaning, EDA, feature engineering, multiple iterations of modeling, rigorous evaluation, interpretation, and communicating your findings.
Real Problem-Solving: Superficial projects often have well-defined paths. Deeper projects are more like real-world assignments - they tend to have ambiguity built in.
You have to define the scope, make choices with incomplete information, and iterate based on what you discover. You might hit dead ends and have to backtrack. This is where real problem solving skills are built.
Nuance and Trade-offs: When you spend months on a project, you have the time to explore the nuances. You can try different modeling approaches, experiment with a wide set of features, and really dig into why certain things work and others don’t. You’re more or less forced to think about trade-offs - model complexity vs. interpretability, precision vs. recall, development time vs. performance.
Communication and Justification: If you’re working on a significant project, you’ll most probably have to explain your methodology and results to others (even if it’s just for a course). This forces you to clarify your thinking, justify your decisions, and learn how to communicate complex technical ideas effectively. And this is one of the important skills for a data scientist I hear.
A portfolio filled with quick, similar projects might look busy, it’s the project where you can talk passionately about the challenges you faced, the iterations you went through, and the lessons you learned along the way that will actually impress and demonstrate your capabilities.
Don’t be afraid to dedicate significant time to one or two complex projects. The depth of understanding you gain will be far more valuable in the long run. IMHO.
9. Your “Best” Model Might Not Be the “Smartest” One
There’s a certain pull to using the latest, most complex, or highest-performing algorithm from some leaderboard. We all want to build “smart” models.
Simply because it makes us feel smart.
However, one of the most practical lessons I’ve learned is that the theoretically “smartest” or most complex model isn’t always the best one for the job in a real-world context.

Practicality, interpretability, and maintainability often matter more than raw predictive power at times.
I’ve had situations where a well tuned XGBoost model achieved a slightly higher AUC score than a simpler logistic regression or decision tree.
But when it came time to explain why the model was making certain predictions, or how a particular input was influencing the outcome, the simpler model was far better.
And often, stakeholders (especially non-technical ones) need that understanding to trust and act on a model’s output.
- Interpretability Matters: If a model is a complete “black box,” it’s hard for users to trust it, especially in high-stakes domains like finance, healthcare, or legal applications. Simpler models are often inherently more interpretable.
- Ease of Deployment and Maintenance: Simpler models are generally easier to deploy, faster to make predictions with, and require less compute. They are also often easier to debug and maintain over time. If a model is going into a production system, these factors can be just as important as a marginal gain in accuracy.
- Stability and Robustness: Sometimes, highly complex models can be “brittle” - they might perform exceptionally well on the specific dataset they were trained on but fail to generalize well to slightly different or new data. Simpler models can sometimes be more robust.
- “Good Enough” is Often Good Enough: What’s the incremental business value of that extra 0.5% in F1 score? If it comes at the cost of significant complexity, longer development time, or reduced interpretability, is it worth it? The answer isn’t always yes. We need to ask: what level of performance is actually needed to solve the business problem effectively?
This doesn’t mean you shouldn’t explore and learn about advanced models.
Absolutely do! But always weigh the benefits of added complexity against the practical costs.
I now ask myself: “Do we really need this level of complexity here? What are we gaining, and what are we potentially losing in terms of clarity, trust, and deployability?”
Sometimes, a well-featured logistic regression is exactly the hero you need.
10. Just Because It’s in the Data Doesn’t Mean It Should Be Used
This one ties into both data cleaning and feature engineering, but it deserves its own spotlight because it touches on an important aspect of responsible data science: feature selection is just as important as feature creation, and sometimes what you exclude is as vital as what you include.
Beyond obvious target leakage, there are other reasons to be selective:
- Noise and Redundancy: Including too many irrelevant or redundant features can actually hurt your model’s performance. They can add noise, making it harder for the algorithm to discern the true signals. They can also increase computational cost and training time.
- Overfitting: Models with too many features (especially relative to the number of observations) are more prone to overfitting - learning the noise in the training data too well and failing to generalize to new, unseen data.
- Interpretability (Again): Fewer, well-chosen features generally make a model easier to understand and explain.
- Ethical Considerations and Bias: This is a huge one. Some features, while potentially predictive, might be proxies for sensitive attributes like race, gender, or socioeconomic status, leading to biased or unfair outcomes. For example, using zip code as a feature in loan applications could inadvertently perpetuate historical redlining if not handled with care and awareness. It’s our responsibility to critically examine our features and ask: “Does this feature make sense to use? Is it fair? Could it lead to harmful discrimination?” This is something I learnt while I was a part of Omdena’s non profit machine learning project to introduce machine learning and AI into a legal scenario for US courts.
Learning to critically evaluate and remove features is a skill.
You might get attached to a feature you spent a lot of time engineering. Yep, you can get attached to features.
But if it’s not adding real, generalizable predictive power, or if it poses an ethical risk, it needs to go.
Ask yourself: “Would I, as a human, use this piece of information to make this decision in a fair and logical way?”
If the answer is no, your model probably shouldn’t either.
This often requires not just statistical analysis (like looking at feature importance scores or running recursive feature elimination), but also strong domain knowledge and ethical reasoning.
This is slightly different than the approach you might take for a deep learning unsupervised model but then again even with those it makes sense to prepare data well in order for your model to work as you intend it to.
11. Machine Learning Projects Are Communication Projects in Disguise
This was a slow-burn realization for me, but it’s become one of my core beliefs about this field.
You can build the most technically brilliant, highest-performing model in the world, but if you can’t explain it clearly, persuasively, and with empathy, its impact will be limited.
Building the model is often just step one; effectively communicating its value, insights, and limitations is where most of the real-world success lies.
Stakeholders, especially non-technicals ones most of the times don’t care about log loss or gradient descent. They care about what the model meant for their business goals: How will this help us reduce costs? How can this improve customer satisfaction? Can we trust these predictions to make better decisions?
I now dedicate a significant portion of my project time to thinking about communication:
- Know Your Audience: Are you talking to other data scientists, product managers, engineers, or executives? Tailor your language, level of technical detail, and visualizations accordingly. Ask “What are their priorities and concerns?”
- Focus on the “So What?”: Don’t just present results; explain their implications. Connect the model’s output directly to the business problem and the decisions it can help make. Instead of saying “The model has an F1-score of 0.75,” try “This model can help us identify 75% of high-risk customers, allowing us to proactively engage them and potentially reduce churn by X%.”
- Visualize for Clarity: Good charts and visuals are incredibly powerful for conveying complex information simply. A well-designed graph can often tell a story much more effectively than a table of numbers or a dense paragraph of text. Think about dashboards, clear summary slides, and intuitive ways to show model predictions or feature importance.
- Tell a Story: Frame your insights as a narrative. What was the problem? What did you discover in the data? How does your model address the problem? What are the key insights and recommended actions? A good story is engaging and memorable.
- Be Honest About Limitations: No model is perfect. Clearly communicate the assumptions you made, the potential biases in the data or model, and the situations where the model might not perform well. This builds trust and manages expectations.
Learning to be a good “translator” between the technical(ML) and the practical world of business or domain experts is a skill that will make you incredibly valuable.
It’s not just about Python and algorithms; it’s about empathy, clarity, and persuasion.
12. A Good Model That No One Understands is a Bad Model (Usually)
This builds directly on the previous point but I wanted to take a couple paragraphs to focus specifically on interpretability.
Especially in applications where decisions have significant consequences - like loan approvals, medical diagnoses, hiring, or churn management - if your model is a complete “black box” that spits out predictions without any discernible logic, people will be hesitant to trust it, adopt it, or rely on it.
And rightly so. Business stakeholders like predictability and a black box does not reinforce predictability and stability.
I used to think that as long as the model was accurate, its internal workings weren’t that important for the end-user.
I’ve now realized that interpretability isn’t just a “nice-to-have”; it’s more or less essential for building trust, enabling debugging, ensuring fairness, and facilitating human oversight.
- Building Trust: If stakeholders can understand why a model makes a certain prediction, they are much more likely to trust its outputs and integrate it into their workflows. If a customer service agent is told to offer a specific retention incentive to a customer flagged by a churn model, understanding the key factors driving that flag (e.g., “decreased usage,” “recent support complaint”) makes the recommendation more actionable and credible.
- Debugging and Improvement: If a model is making strange or incorrect predictions, interpretability can help you diagnose the problem. Are there specific features that are having an undue influence? Is it learning spurious correlations? Understanding the “reasoning” can guide your efforts to improve it.
- Fairness and Bias Detection: Interpretability tools can help uncover if a model is relying on sensitive or proxy variables in an unfair way. If you can see that a certain demographic group is consistently receiving adverse predictions due to a particular feature, you can investigate and mitigate that bias.
- Regulatory Compliance and Accountability: In some industries (like finance with credit scoring), there are legal requirements for models to be explainable. Even without explicit regulation, being able to explain how a decision was made is crucial for accountability.
Simpler models like linear regression or decision trees are inherently more interpretable, but even for more complex models (like ensemble methods or neural networks), there are tools and techniques to help explain their behavior simply.
- SHAP (SHapley Additive exPlanations) and LIME (Local Interpretable Model-agnostic Explanations) can help explain individual predictions by showing the contribution of each feature. I’ve found these quite useful for understanding what pushes my models, even if just for my own sanity.
- Partial Dependence Plots (PDPs) or Individual Conditional Expectation (ICE) plots can help visualize how a model’s prediction changes as you vary a specific feature.
The key mindset shift for me was moving from “Is this model accurate?” to “Is this model useful, trustworthy, and actionable?”
A model’s job isn’t just to predict; it’s to provide insight and support better human decision-making.
And that almost always requires a degree of clarity and interpretability.
13. MLOps is Real, and It Will Come for You (Eventually, and Sooner Than You Think)
When I first started, “MLOps” sounded like something only big tech companies with armies of engineers needed to worry about.
My focus was on getting my models to work in a Jupyter Notebook.
Reproducibility? Versioning data? Tracking experiments systematically? That felt like overkill for my relatively small student projects.
The wake-up call came when I had to come back to a project after a few months because I wanted to build on it as a portfolio project.
I needed to re-run a model, possibly with slightly updated data.
And I realized that I couldn’t quite remember all the specific preprocessing steps I’d taken before landing on the one that was now in my notebook.
It was a mess.
That’s when I understood that MLOps isn’t just for massive scale; it’s about professionalism, reproducibility, and efficiency, even for personal projects.

MLOps is a broad field, but here are a few foundational concepts that I’ve started incorporating, even into my own learning projects, that have made a huge difference:
- Experiment Tracking: Tools like MLflow (which is open source and relatively easy to get started with) or Weights & Biases allow you to log your model parameters, metrics, code versions, and even output artifacts for every run. This creates an organized history of your experiments, making it easy to compare results and recall what worked. No more
model_final_v2_actually_final_really_final.ipynb! - Code Structure and Modularity: Moving away from monolithic Jupyter Notebooks for anything more than initial exploration. Structuring code into reusable Python scripts for data preprocessing, feature engineering, training, and evaluation makes it much more manageable, testable, and easier to integrate into a pipeline.
- Data and Model Versioning: Just like you version your code with Git, you should also think about versioning your datasets and your trained models. This ensures that if you need to reproduce a result or understand why performance changed, you can trace back the exact data and model artifact used.
- Basic Automation/Pipelines: Even a simple shell script or a Python script that runs your sequence of data processing, training, and evaluation steps can save a lot of manual effort and reduce errors.
You don’t need to become an MLOps expert overnight.
But starting to think about these principles early and incorporating even simple practices will make your life much easier, your work more reliable, and your skills more valuable.
There are tons of great blogs and video tutorials on MLOps - just start small and build up.
14. Churn (or Any Target Variable) Isn’t Just a Number. It’s a Story
When I built my first churn prediction model, my primary focus was, naturally, on the prediction itself: Will this customer churn, yes or no? How accurate is my model at making this binary classification?
But as I spent more time with the problem and the data, I realized: understanding why customers churn, and what the underlying drivers are, is often far more valuable than just predicting the event itself.
The target variable isn’t just a ‘0’ or a ‘1’; it represents a story, an outcome of different factors and experiences.
This shift in perspective changed how I approached the entire project.
- Prediction to Insight: I started paying much more attention to feature importance scores from my models.
Which factors were most strongly correlated with a customer’s decision to leave?
- Was it poor customer service interactions (e.g., high number of support tickets)?
- Was it a lack of engagement with key product features?
- Was it price sensitivity in a particular segment?
- Actionable Insights for Business Strategy: These insights, derived from the model, could then be translated into potential business actions. If “number of unresolved support tickets” is a major churn driver, the business can focus on improving customer service response times or first-call resolution. If “low usage of new premium features” is a flag, perhaps better onboarding or targeted marketing for those features is needed.
- Segmentation and Personalization: Understanding churn drivers can also help segment customers. Are there different “churn personas” who leave for different reasons? This allows for more targeted and effective retention strategies rather than a one-size-fits-all approach.
- Narrative Building: The model and its EDA became tools for building a narrative about the customer journey and the points where trust or value might be leaking. This is often what works well with stakeholders and drives change.
I came to see that my role wasn’t just to identify which customers were likely to leave, but to help the business understand the “story of churn” within their customer base.
This meant looking at patterns, understanding the context, and connecting the dots in a way that could inform proactive strategies.
So, whatever you’re trying to predict, remember to look beyond the prediction itself.
Dig into the “why.” That’s often where the best insights and the opportunities for impact tend to lie.
15. You Will Feel Like an Imposter. And You Are Not Alone
Let’s be honest: there have been tons of moments this past year where I’ve felt like a complete fraud.
When I couldn’t get a model to work after hours of trying.
When someone in a lecture asked a question about the underlying math of an algorithm that made me freeze right there in my shorts (remote lectures so no pants lol).
When I read a great blog post or a cutting-edge research paper and felt hopelessly behind because I felt like I was reading gibberish.
That little voice whispering, “You don’t belong here. You’re not smart enough for this. You’re a marketer, you can’t do this. You’ve always been behind at Maths, what are you going to do in ML. So what if you did an ML project as your graduation thesis, its been a decade, don’t be naive, quit this and go back to being a marketing guy.”
That’s impostor syndrome, and it’s incredibly common in this field (and many others, especially for learners).
What I’ve slowly, and painfully, come to realize is that almost everyone feels this way at some point, even the people you look up to as experts.
In tech, a field that’s constantly evolving, with new tools, techniques, and research appearing daily, it’s virtually impossible to know everything.
- It Means You’re Learning: Often, that feeling of inadequacy pops up when you’re learning something new, tackling something new and challenging. And that’s exactly where growth happens. If you always felt completely comfortable, you probably wouldn’t be learning much.
- The Field is Vast: Data science and machine learning are incredibly broad. There are specialists in NLP, computer vision, reinforcement learning, MLOps, data engineering, causal inference, ethics… No one is an expert in all of it. It’s okay to have areas where you’re still learning (which is, for most of us, most areas!).
- Comparison is the Thief of Joy (and Confidence): It’s so easy to look at someone else’s curated GitHub profile or their impressive job title and feel like you’re falling short. But you’re only seeing their highlight reel, not their struggles, their own moments of doubt, or the years of work that got them there. Focus on your own journey and your own progress.
So, when that feeling of impostor syndrome hits (and it probably will, multiple times), try to acknowledge it without letting it derail you.
Remind yourself that it’s a common part of the learning process.
Focus on what you have learned, celebrate your small wins, and keep putting one foot in front of the other.
It means you care about what you’re doing and that you’re challenging yourself.
And that, in itself, is something to be proud of.
16. Learning is Bigger Than Specific Tools
Python. Pandas, NumPy, Scikit-learn. Matplotlib, Seaborn. TensorFlow, PyTorch. SQL. Git. Docker. Cloud platforms like AWS or GCP.
The list of tools and tech in the data science ecosystem can seem endless and, a bit daunting when you’re starting out.
I definitely felt pressure to learn all the things.
While proficiency in relevant tools is important (and you will need to get comfortable with a core set like Python and the core data science libraries), I’ve come to believe that the underlying concepts and the problem-solving mindset are far more critical and enduring than mastery of any single tool.
Tools Evolve, Fundamentals Stay Strong: The hot new library or framework today might get dumped on by something else in a few years. But the fundamental principles of statistics, how to frame a problem, how to critically evaluate data, how to design experiments, and how to interpret results - these are timeless.
Focus on “How to Think”: Can you take an ambiguous problem and break it down into manageable, data-addressable questions?
- Can you think about potential biases and limitations?
- Can you choose an appropriate methodology for the task at hand?
- Can you clearly articulate your assumptions and your findings?
These “thinking” skills are tool-agnostic and will serve you well regardless of the specific software you’re using.
Transferable Skills: Once you understand why you’re doing something (e.g., why you need to normalize features or why a certain evaluation metric is appropriate), learning the syntax to do it in a new tool is often much easier. The conceptual understanding is the harder, more valuable part.
Avoid “Tool-Driven” Problem Solving: Don’t let your comfort with a specific tool dictate how you approach every problem (“I know how to use random forests, so I’ll use a random forest here!”). Instead, let the problem decide your choice of methods and, consequently, tools.
So yes, learn the tools.
Get your hands dirty with code.
Build things.
But don’t define yourself or your abilities solely by the list of software on your resume.
Prioritize understanding the “why” behind the “what,” and cultivate your analytical and critical thinking.
Those are the skills that truly make a data scientist adaptable and valuable in the long run.
17. It’s Okay to Go Slow on the Math. But Please, Don’t Skip It
There were definitely moments, particularly when going into the theory behind certain algorithms, where the math felt crazy.
Eigenvectors and eigenvalues for PCA?
The calculus behind backpropagation in neural networks?
The statistical assumptions underpinning linear regression?
I’d stare at the equations, and my eyes would start watering.
The temptation to just import the library, run .fit() and .predict()was strong.
While you don’t necessarily need to be able to derive every formula from scratch to be an effective applied data scientist, I’ve learned that taking the time to understand the underlying mathematical and statistical concepts - even at an intuitive level - is really helpful.
Skipping it entirely can leave you vulnerable.
- Deeper Understanding and Confidence: When you have at least a conceptual grasp of how an algorithm works, you become more confident in using it appropriately. You understand its strengths, its weaknesses, and the assumptions it’s making. This helps you to make more informed choices about which algorithm to use and how to interpret its results.
- Better Debugging: If your model is behaving unexpectedly, having some understanding of its internal mechanics can help you troubleshoot. Is it struggling with outliers because of the way its loss function is defined? Are your features scaled inappropriately for an algorithm that’s sensitive to feature magnitudes?
- Informed Hyperparameter Tuning: Many hyperparameters directly relate to the underlying math. Understanding what they control allows you to tune them more intelligently than just randomly trying values.
- Explaining to Others (and Yourself): If you need to explain why a model is making certain predictions, or why you chose a particular approach, having that foundational knowledge (even if you simplify it for your audience) adds a lot of credibility.
- Moving Beyond Black Boxes: Relying solely on high-level library calls without any understanding of what’s happening underneath can limit your ability to customize, adapt, or innovate.
It’s okay if it takes time.
It took me weeks to get an intuitive feel for some concepts and months for others.
I re-read explanations, watched videos (shoutout to resources like 3Blue1Brown on YouTube for amazing visual explanations of complex math), and worked through examples slowly.
For math specifically I also took the specialization of mathematics for machine learning on coursera which was damn helpful - and I finished it twice in 1 year, and probably will do it once more in the next couple of months.
The goal isn’t necessarily to become a research mathematician, but to build enough intuition so that the algorithms aren’t just magic.
Go at your own pace, use different resources, but don’t shy away from the math.
18. The Best Learning Comes From Projects, Not Just Courses
Courses, bootcamps, and textbooks are great for providing structure, introducing new concepts, and giving you a foundational roadmap.
But I’ve found that the most impactful, sticky learning comes from applying that knowledge by working on end-to-end projects.
There’s a world of difference between watching a lecture on logistic regression and actually trying to implement it on a messy dataset, struggling with feature scaling, interpreting the coefficients, and then trying to explain your findings.
- Active vs. Passive Learning: Courses can sometimes be a passive experience. Projects force you into active problem-solving. You have to make decisions, encounter errors, search for solutions, and iterate. This struggle is where “deep learning” happens. (did you see what I just did there?)
- Connecting the Dots: Projects require you to integrate knowledge from different areas. You’re not just learning about data cleaning in one module and modeling in another; you’re doing it all together, seeing how the pieces fit and influence each other.
- Dealing with Reality: Real (or realistic) project data is messy and ambiguous. Courses usually simplify this. Projects throw you into the complexities, forcing you to adapt and develop a more robust skillset.
- Building a Portfolio (and Confidence): Completing a project, especially one you’re passionate about or that solves a real problem, gives you something tangible to show for your efforts. More importantly, it builds your confidence in your ability to actually do data science.
If you feel like you’re stuck in “tutorial hell” - passively consuming content without feeling like your skills are truly growing - the best antidote is to start a project.
Pick a dataset that interests you (Kaggle, government open data sites, or even data you collect yourself).
Define a question you want to answer or a problem you want to solve.
And then try to build something, however small, from start to finish.
Break it. Fix it. Learn from it.
That cycle of building, struggling, and overcoming is the fast track to mastery.
19. Just-in-Time Learning Usually Beats Just-in-Case Learning
When I first got serious about data science, I was a resource hoarder. I had tons of bookmarked articles, downloaded PDFs of research papers, saved tutorials - all on topics I thought I might need “just in case.”
My thinking was, “I need to learn all of this before I can be effective.”
The result? Burnout and a lot of unread material.
I’ve since moved much more towards a “just-in-time” learning approach.
This means focusing my learning efforts on what I need to solve the specific problem or understand the specific concept I’m working with right now.
- Motivation and Relevance: When you’re trying to solve an immediate problem, your motivation to learn the skills or concepts is much higher. The information feels directly relevant and applicable, which helps with comprehension and retention. Trying to learn about, say, advanced time series models “just in case” is much harder than learning about them when you’re actively working on a forecasting project.
- Reduces Overwhelm: The sheer volume of information in data science can be paralyzing. A just-in-time approach allows you to learn in more manageable chunks, focusing on depth in the area you currently need, rather than trying to achieve breadth across everything simultaneously.
- Faster Application, Better Retention: When you learn something and immediately apply it, you’re much more likely to remember it. The practical application solidifies the theoretical knowledge.
- Builds Resourcefulness: This approach also builds the skill of knowing how to find information and learn new things efficiently when you need them. You become more confident in your ability to tackle unfamiliar challenges because you trust your capacity to learn what’s required on the fly.
This doesn’t mean foundational learning isn’t important.
You still need that core understanding from courses and broader study.
But for specialized topics or new tools, learning them in the context of a current need is often far more effective and less stressful than trying to master everything beforehand.
It’s about being lean and targeted in your learning efforts.
20. The AI Hype is Real. So is the Grind of Fundamentals
It’s an exciting time to be in data science and machine learning.
Every week or maybe every hour, it seems there’s a new groundbreaking paper, a powerful new AI model, or a new tool that promises to revolutionize some part of the workflow.
The hype is crazy, and it’s easy to feel like you need to be constantly chasing the latest and greatest.
It’s important to stay aware of these and even experiment with new tools or the latest foundation models, I’ve also come to appreciate that the foundational skills of data science remain timeless and essential.
The “grind” of learning how to properly clean data, engineer meaningful features, understand statistical principles, evaluate models rigorously, and communicate insights effectively - these things don’t go out of style.
Fundamentals are Your Anchor: The tools and specific algorithms will change. The core principles of how to approach data-driven problem solving will endure. A strong foundation makes you more adaptable when new technologies emerge. You’ll be better equipped to understand how these new tools work and where they fit into the broader landscape.
Don’t Neglect the Basics: It can be tempting to jump straight to playing with advanced AI models. But if you haven’t mastered the fundamentals of data preprocessing or evaluation, you’ll struggle to use those advanced tools effectively or critically.
Garbage in still means garbage out, no matter how sophisticated the model.

Hype vs. Practical Application: Some new tech is genuinely transformative, others might be overhyped or not yet mature enough for practical application in all contexts. Being able to understand this requires a solid understanding of the underlying challenges and trade-offs in data science.
Pace Yourself and Avoid Burnout: Trying to keep up with every single new development is a recipe for burnout. It’s okay to focus on mastering the fundamentals and then strategically explore new areas that are relevant to your interests or projects. This is a marathon, not a sprint.
So, by all means, engage with the hype.
Be curious.
Experiment.
But don’t do it at the expense of building a rock-solid foundation in the core principles and practices of data science.
That foundation is what will allow you to navigate the changing landscape with confidence and make a real impact.
21. Stop Comparing Your Timeline to Someone Else’s
This is a lesson I have to remind myself of constantly.
In a field that attracts people from such diverse backgrounds - some with computer science PhDs, some transitioning from completely unrelated careers (my sister is a former chef turned data scientist now in a big 4/5 companies in tech consulting), some starting their journey at 18, others at 40 - it is incredibly easy to fall into the comparison trap.
You see someone who seems to be learning faster, achieving more, or landing impressive roles, and you start to question your own progress and abilities.
I’ve learned that progress in this field is deeply personal, and everyone’s timeline and path will look different.
Comparison is not only unproductive; it can be really begative for your motivation and self-esteem.
Different Starting Points, Different Goals: Everyone comes in with a unique set of prior experiences, skills, and learning styles. Your background in, say, biology might give you a unique perspective on certain datasets that someone with a pure math background wouldn’t have, and vice-versa. Your career goals might also be different, leading you to focus on different areas.
Invisible Struggles: You rarely see the full picture of someone else’s journey - the late nights, the failed attempts, the moments of doubt, the lucky breaks, or the specific support systems they might have. You’re often comparing your “behind the scenes” with their “highlight reel.”
Focus on Your Own Growth: The most important metric is your own progress over time. Are you learning more than you knew last month? Are you building skills? Are you tackling more challenging problems?
That’s what truly matters.
Celebrate Your Milestones: Acknowledge and celebrate your own achievements, however small they may seem. Finishing a tough project, finally understanding a complex concept, getting a piece of code to work - these are all small wins worth recognizing.
This journey is your own.
Be inspired by others, learn from them, but don’t measure your worth or your pace against theirs.
Stay focused on your learning, be persistent, and trust that you’re moving forward.
You’re probably doing much better than you think.
22. Build in Public (A Lesson I’m Learning Now)
This final point is one that, if I could go back and tell my Day 1 self something, this would be high on the list.
For a long time, I kept my learning journey pretty private.
I worked on projects, struggled through concepts, but was hesitant to share what I was doing, what I was learning, or (especially) what I was confused about.
My thinking was, “I’ll wait until I’m an expert, until I have something polished to show.”
Especially since I had seen reddit comments for “learn publically.”
I now believe that was a missed opportunity. Building in public - sharing your learning process, your projects (even the messy ones), your insights, and your questions along the way - can be an incredible catalyst for growth, connection, and even helping others.
Accelerated Learning: The act of trying to explain something you’re learning to others (even in a blog post, a tweet thread, or a small presentation to peers) forces you to clarify your own understanding. (classic Feynman technique) It exposes gaps in your knowledge that you can then address.
Teaching is one of the best ways to learn.
Building a Network: When you share what you’re working on, you connect with other people who are interested in the same things.
You can find mentors, collaborators, and peers who can offer support, advice, and different perspectives.
Documenting Your Journey: Sharing your progress creates a public record of your growth. This can be incredibly motivating to look back on. It also acts as an informal portfolio that shows your skills and your passion.
Helping Others (Even as a Beginner): You don’t need to be an expert to provide value. Sharing your struggles and how you overcame them as a beginner can be incredibly helpful and relatable to others who are just starting out. Your “dumb questions” might be the exact questions someone else is too afraid to ask.
Feedback and Improvement: Putting your work out there opens you up to feedback, which can be invaluable for improvement (once you learn to filter the constructive from the noise).
So, this blog you’re reading? This is me trying to get into that “build in public” philosophy, even if it feels a bit vulnerable.
If you’re on this journey too, I encourage you to consider sharing it.
Write about what you’re learning.
Post your small projects on GitHub.
Ask questions in online communities.
You might be surprised by how much it helps your own experience and how many people you can connect with and help along the way.
And that’s the brain dump after a year in this awesome, challenging, and a bit crazy field.
It’s been a ride, and I know I’m still just scratching the surface.
But these are the lessons that have felt most significant so far.
Hopefully, some of them resonate with you, wherever you are on your own data science and machine learning adventure.
Keep learning, keep building, and keep asking questions!